
Know if the deal works — before you make the offer.
Two numbers is all it needs. Caprately runs the underwriting math institutions use — cash flow, cap rate, DSCR, a 10-year projection — and tells you in dollars how far the asking price is from one that works. Buy, negotiate, or walk.
Both are free, and neither asks for an account. See a sample report.
- Cash flow & ROI instantly
- DSCR & break-even occupancy
- 10-year projections
- The price that would make it work
Caprately · Deal analysis
Try it — edit any number
PASSCap rate
7.9%
Cash flow
$498/mo
Cash-on-cash
7.8%
DSCR
1.36x
Works up to $323,510 against these criteria — break-even at 77.8% occupancy. Other costs estimated from standard rules of thumb.
See the math on worked examples, analyze any property in seconds, and watch the ones you buy compound toward the day your rentals cover your life.
Three moves, one outcome: not a calculator you open when you have to — a place you return to because the number keeps climbing.
Sample properties, scored live
Illustrative properties across 24 real markets. Every verdict and every number is computed by the engine as this page loads — the properties are examples, the underwriting is not.
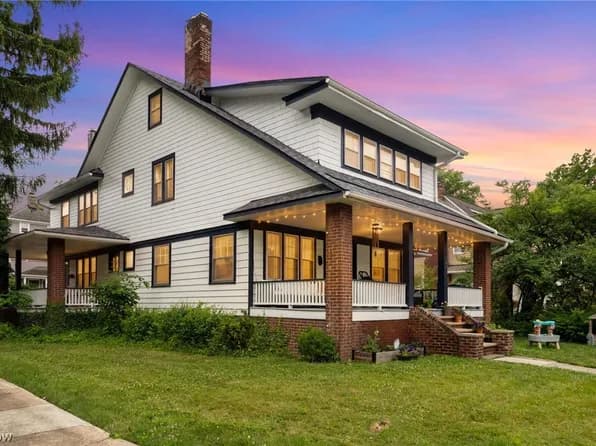
Craftsman duplex · Cleveland, OH
$339,000
- $408/mo cash flow after debt service
- DSCR 1.24x clears the 1.2x lender bar
- 5.3% cash-on-cash return
- Breaks even at 84% occupancy
Assumes 25% down at 7% / 30yr · $3,650/mo market rent · cap rate 7.4%
Everything you need to screen deals fast
The analysis engine and listing import are live today. Cloud-synced deals and reports are next.
Cash flow & NOI
Itemized income and expenses, vacancy-adjusted, rolled up into monthly and annual net operating income.
Cap rate & cash-on-cash
See the two numbers every investor checks first, computed the same way underwriters do.
DSCR & break-even occupancy
Know exactly how much vacancy or rent drop a deal can absorb before it stops paying for itself.
10-year projections
Rent growth, expense growth, appreciation, and amortization modeled year by year.
The price that would work
Not just a verdict — the exact price at which this property clears every threshold, and the gap in dollars between that and what the seller is asking.
Paste a Zillow or Redfin link
Drop a listing URL and Caprately reads the address, then applies that state's real tax and insurance rates. Paste the whole listing page and it pulls the price, rent, and size out of the text too.
Why trust the numbers
Institutional-grade analysis, priced for individual investors.
Both calculators, the portfolio, and listing import are live today. Deal alerts and cloud sync are next.
421 automated tests
Every calculation is covered — cash flow to IRR.
Zero early rounding
Nothing is rounded until the display layer, so errors never compound.
No black box
Every metric opens to reveal its formula and this deal's numbers substituted into it.
A real deal, fully underwritten
Every number below comes straight out of Caprately's analysis engine — nothing here is hand-picked or rounded early.
Fits the criteria — tightest is DSCR at 1.34x
Clears every bar: $468/mo of cash flow on $77,750 invested.
That's a 7.2% cash-on-cash return, with the income covering the loan 1.34x over. Verify the tax bill and get a real insurance quote before you offer.
Property
$285,000 purchase · 25% down · 6.67% / 30yr
Gross monthly rent
$2,900
1.02% of price/mo
Monthly cash flow
$468
Show the formula
effective rent − operating expenses − mortgage payment
$2,755 − $912 − $1,375 = $468/mo
NOI (annual)
$22,116
Show the formula
(effective rent − operating expenses) × 12
($2,755 − $912) × 12 = $22,116
Cap rate
7.8%
Show the formula
annual NOI ÷ purchase price
$22,116 ÷ $285,000 = 7.8%
Cash-on-cash return
7.2%
Show the formula
annual cash flow ÷ total cash invested
$5,616 ÷ $77,750 = 7.2%
DSCR
1.34x
Show the formula
monthly NOI ÷ mortgage payment
$1,843 ÷ $1,375 = 1.34x
Break-even occupancy
78.9%
Show the formula
(operating expenses + mortgage payment) ÷ gross rent
($912 + $1,375) ÷ $2,900 = 78.9%
Loan amount
$213,750
Show the formula
purchase price − down payment
$285,000 − $71,250 (25%) = $213,750
Monthly P&I payment
$1,375
Show the formula
amortized loan payment (rate ÷ 12, term × 12)
$213,750 at 6.67% over 30 yrs = $1,375/mo
Annualized return if you sold in year 10
17.2%a year
Counts the $77,750 you put in up front, 10 years of cash flow, and the $191,904 left after paying off the loan and 7% in selling costs. Unlike cash-on-cash, it accounts for when each dollar arrives — which is what makes it comparable to a return quoted on a stock or a bond.
This is the least certain number on the page. Most of it comes from the sale, and the sale assumes 3.5% appreciation every year for 10 years. Change that one assumption and this figure moves further than any of the ones above.
Show the cash flowsThe cash flows
the rate at which every flow below discounts back to zero
- Now-$77,750
- Year 1$5,616
- Year 2$6,389
- Year 3$7,187
- Year 4$8,011
- Year 5$8,863
- Year 6$9,742
- Year 7$10,650
- Year 8$11,588
- Year 9$12,556
- Year 10$205,461
Year 10 includes the sale. Nothing here is money in your pocket until the property actually sells.
Equity grows from $83,538 in year 1 to $220,046 in year 10, driven by loan paydown and property appreciation.
| Year | Equity |
|---|---|
| 1 | $83,538 |
| 2 | $96,334 |
| 3 | $109,662 |
| 4 | $123,546 |
| 5 | $138,010 |
| 6 | $153,083 |
| 7 | $168,793 |
| 8 | $185,168 |
| 9 | $202,242 |
| 10 | $220,046 |
Don't just analyze deals. Build toward freedom.
Add any deal to your portfolio and Caprately tracks your combined cash flow toward the day your rentals cover your life. Set a goal, watch the number climb, and see exactly how many more properties stand between you and financial freedom.
- Set your own passive-income goal
- Projected cash flow across every deal you add
- Know how many deals you are from the finish line
Monthly passive income
Goal · $10,000
$3,540
35% of the way to $10,000/mo — you're about 6 properties from your goal.
3
Properties
$382k
Deployed
11.1%
Cash-on-cash
Real estate terms, translated
Every metric in a Caprately analysis, explained the way you'd want a friend to explain it.
Cash flow
What's left each month after vacancy, operating expenses, and the mortgage. Positive cash flow means the property pays you to own it.
NOI
Net operating income — rent minus operating expenses, before the mortgage. It's the number cap rate is built on.
Break-even occupancy
The occupancy level where income exactly covers every cost. The lower it is, the more vacancy a deal can absorb before it starts losing money.
Vacancy rate
The share of the year a unit sits empty between tenants. Even strong rentals should budget around 5% — assuming zero is how deals go wrong.
CapEx reserve
Monthly savings for big-ticket replacements — roof, HVAC, water heater. Setting it aside every month keeps one bad year from wiping out three good ones.
IRR
Internal rate of return — the annualized return counting cash flow, loan paydown, appreciation, and when the money arrives. The projection's bottom line.
Appreciation
Growth in property value over time. Real upside, but never count on it to rescue negative cash flow — it's the bonus, not the plan.
Equity
Property value minus what you still owe. It grows two ways at once: the loan gets paid down while the value climbs.
“It pencils”
Investor slang for a deal whose numbers actually work. It's the question every screen here is built to answer.
Questions, answered
Is Caprately really free?
Yes — all of it. The calculator, the projections, and the underwriting result are free to use with no account required. There is no paid tier and nothing is held back behind one.
Where do the numbers come from?
A deterministic finance engine. Every metric — cash flow, cap rate, DSCR, IRR, the 10-year projection — is computed by tested code (421 automated unit tests) that never rounds until the display layer. Click any metric in a result and it shows you its exact formula with your numbers substituted in.
Does Caprately use AI?
Not for the analysis, and that's deliberate. Every figure — cash flow, DSCR, the max workable price, the ten-year projection — comes from arithmetic you can check by hand, and the site shows you the formula with your own numbers substituted in. A language model asked to underwrite a property will produce a confident figure nobody can verify, which is the opposite of what this is for. The Learn section has an optional explainer that answers questions about the assumptions, and anything it writes is labelled as machine-written. The math never is.
How do I know what a property will rent for?
You often don't, and the calculator is built around that. Enter just the price and it tells you the rent the property would need to clear every threshold — so instead of guessing a number you only have to judge whether that one is achievable. Once you enter a rent, it shows the deal at the bottom, middle and top of the plausible range, and names the rent where the answer flips. It deliberately never invents a rent for you: rent estimated from the purchase price would make every property score the same.
Can I paste a Zillow or Redfin link?
Yes. Paste a listing link at the top of the calculator and Caprately reads the address straight from the URL — never by scraping the page — and applies that state's tax and insurance rates. A link doesn't carry the price or the rent, so either type those two or paste the whole listing page and they're pulled out of the text. Automated estimates from a licensed data provider can be switched on, and aren't yet.
What's the difference between Simple and Advanced mode?
Simple mode estimates taxes, insurance, vacancy, upkeep, and closing costs from standard rules of thumb so you can screen a deal in seconds. Advanced mode opens every assumption — itemized expenses, growth rates, rehab budget — so you can underwrite it properly.
How accurate are Simple mode's estimates?
Property tax and insurance come from your state's real effective rates, not one national average — tax alone runs from 0.29% of value a year in Hawaii to 1.88% in New Jersey, and California is priced at the post-Proposition-13 rate a buyer actually pays. The rest are conservative rules of thumb: 5% vacancy, 8% of rent for management, upkeep priced per square foot when you give a size. Insurance is the roughest of them. Before you offer on a real property, switch to Advanced and plug in the actual bill and a real quote.
Is this financial advice?
No. Caprately is a screening and analysis tool. It shows you what the numbers say, and shows its work — but every deal deserves independent verification, local knowledge, and your own judgment.
Free to use, no account
Ready to underwrite your next deal?
Four numbers in, a full analysis out — cash flow, verdict, a ten-year projection, and the offer that makes it pencil.